Over the years, Bitcoin and other cryptocurrencies have significantly grown in popularity. As interest has surged, so has the need for analysis tools to provide traders and investors with insights into the market. Technical analysis, relying on historical price and volume data, employs a range of indicators and oscillators. In this article, we’ll focus on three of the most prominent: the Moving Average (MA), the Relative Strength Index (RSI), and the Moving Average Convergence Divergence (MACD).
1. Moving Average (MA)
The Moving Average is a simple yet powerful tool designed to smooth out the price of an asset over a designated period, thus reducing short-term volatility.
- Simple Moving Average (SMA): This calculates the average price over a specified period. For instance, a 50-day SMA would represent the average price of Bitcoin over the last 50 days.
- Exponential Moving Average (EMA): This places greater weight on recent prices, resulting in a faster response to price changes.
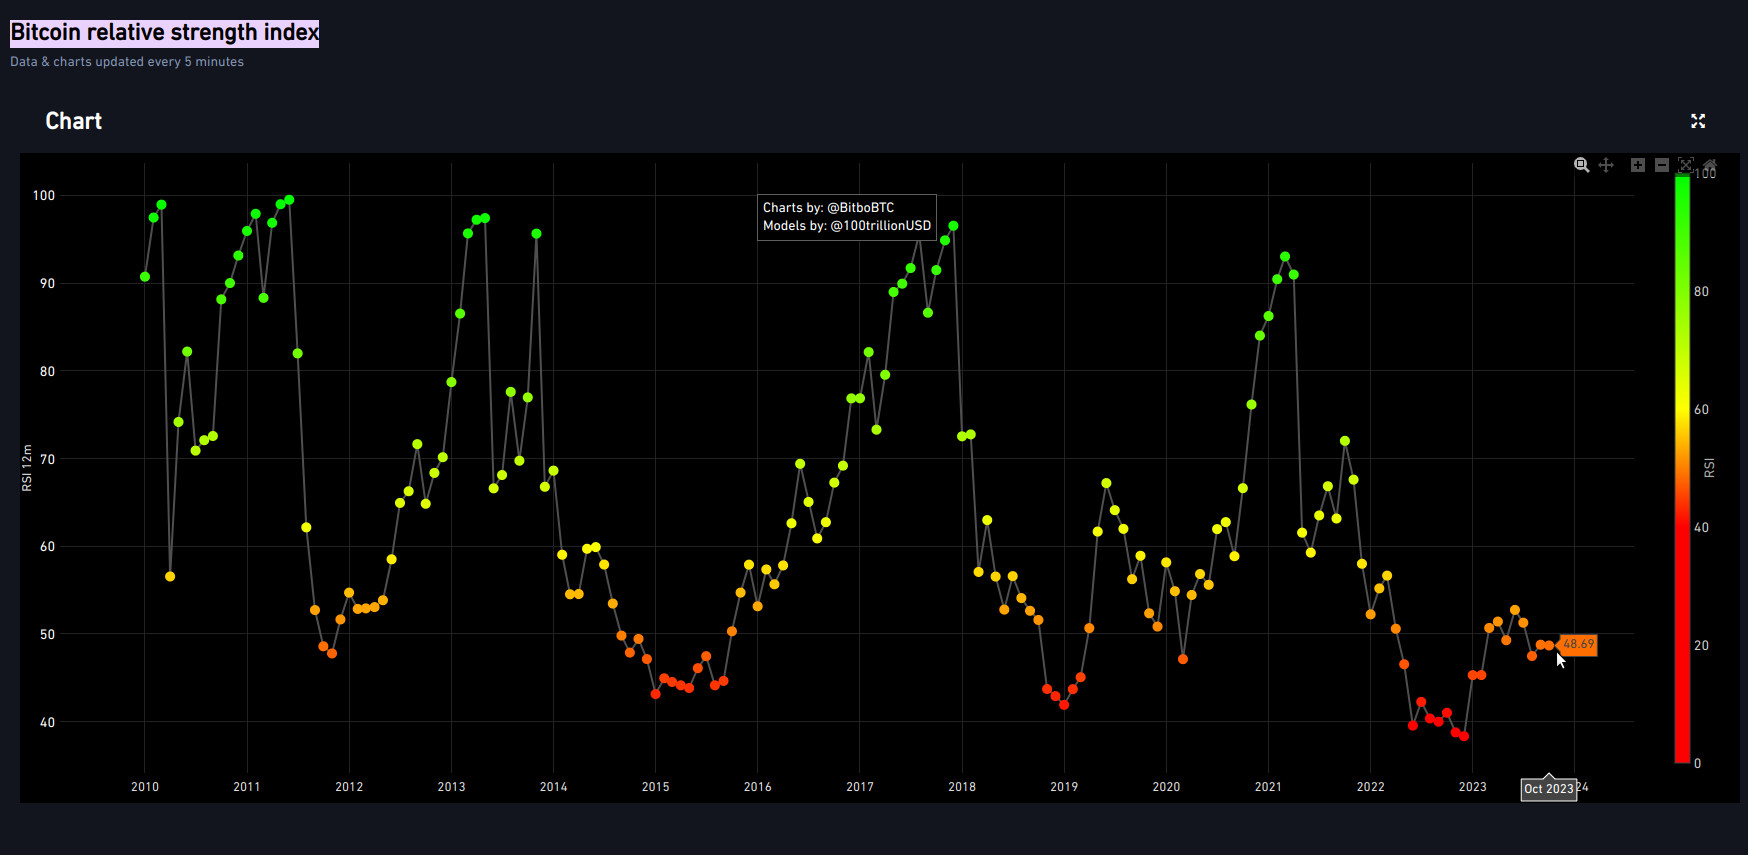
2. Relative Strength Index (RSI)
The RSI is a momentum oscillator that gauges whether an asset is overbought or oversold. It oscillates between 0 and 100 and is often used to pinpoint potential trend reversals.
- An RSI value above 70 might suggest that an asset could be overbought, indicating a potential correction.
- Conversely, a value below 30 might indicate that an asset could be oversold, signaling a potential upward movement.
3. Moving Average Convergence Divergence (MACD)
MACD is a trend-following momentum indicator that shows the difference between two exponential moving averages.
- MACD consists of the MACD line (the difference between a 12-day EMA and a 26-day EMA) and a signal line (the 9-day EMA of the MACD line).
- A crossover of the MACD line above the signal line can be interpreted as a buying signal, while a crossover below might indicate a selling signal.
Conclusion
While these indicators and oscillators can offer valuable insights into the Bitcoin market, they should never be used in isolation. It’s always advisable to use a combination of analysis tools and methodologies, taking into account the fundamental market conditions. Technical analysis doesn’t provide guarantees, but it can assist traders in making more informed decisions and adjusting their trading strategies accordingly.